(1) ‘Doji’
A name for candlesticks that provide information on their own and also feature in a number of important patterns. Dojis form when a security’s open and close are virtually equal.
A doji candlestick looks like a cross, inverted cross or plus sign. Alone, doji are neutral patterns.
(2) ‘Gravestone Doji’
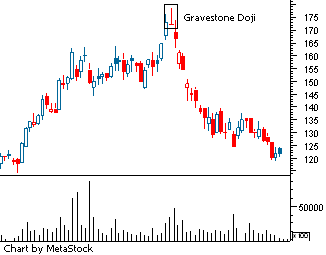
A type of candlestick pattern that is formed when the opening and closing price of the underlying asset are equal and occur at the low of the day. The long upper shadow suggests that the day’s buying buying pressure was countered by the sellers and that the forces of supply and demand are nearing a balance.
This pattern is commonly used to suggest that the direction of the trend maybe be nearing a major turning point.
A gravestone doji pattern is a common reversal pattern used by traders to suggest that a bullish rally or trend is about to reverse. It can also be found at the end of a downtrend, but this version is much more rare.
As you can see from the chart, on the day of the gravestone doji (shown within the black box), bearish traders realized that the price was pushed up to unjustifiably high levels so they send the price back up to where the stock opened. The close near the day’s low suggests that supply is starting to outweigh demand again.
(3) ‘Dragonfly Doji’
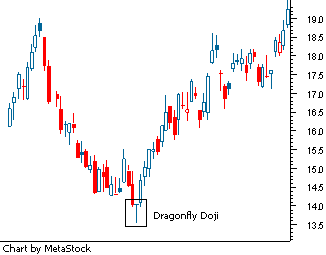
A type of candlestick pattern that signals indecision among traders. The pattern is formed when the stock’s opening and closing prices are equal and occur at the high of the day.
The long lower shadow suggests that the forces of supply and demand are nearing a balance and that the direction of the trend may be nearing a major turning point.
A dragonfly doji pattern is a relatively difficult chart pattern to find, but when it is found within a defined trend it is often deemed to be a reliable signal that the trend is about to change direction.
As you can see from the chart, on the day of the dragonfly doji (shown within the black box), traders realize that the price was sold down to unjustifiably low levels so they send the price back up to where the stock opened.
The close near the day’s open suggests that demand is again starting to outweigh supply.
(4) ‘Hammer’
A price pattern in candlestick charting that occurs when a security trades significantly lower than its opening, but rallies later in the day to close either above or close to its opening price. This pattern forms a hammer-shaped candlestick.
A hammer occurs after a security has been declining, possibly suggesting the market is attempting to determine a bottom.
The signal does not mean bullish investors have taken full control of a security, it simply indicates that the bulls are strengthening.
(5) ‘Hanging Man’
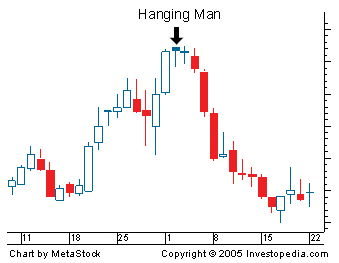
A bearish candlestick pattern that forms at the end of an uptrend. It is created when there is a significant sell-off near the market open, but buyers are able to push this stock back up so that it closes at or near the opening price.
Generally the large sell-off is seen as an early indication that the bulls (buyers) are losing control and demand for the asset is waning.
This formation does not mean that the bulls have definitively lost control, but it may be an early sign that the momentum is decreasing and the direction of the asset may be getting ready to change.
The reliability of this signal is drastically improved when the price of the asset decreases the day after the signal. Hanging man formations can be more easily identified in intraday charts than daily charts and are a very popular formation used by day traders.
If this pattern is found at the end of a downtrend, it is known as a “hammer”.
(6) ‘Dark Cloud Cover’
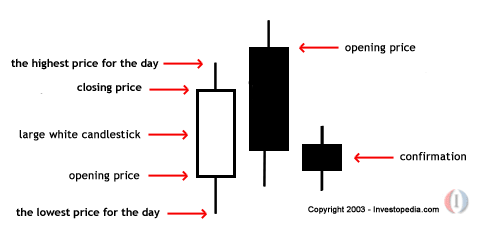
In candlestick charting, a pattern where a black candlestick follows a long white candlestick. It can be an indication of a future bearish trend.
Essentially, the large black candle is forming a “dark cloud” over the preceding bullish trend.
The dark cloud must have a closing price that is:
1) within the price range of the previous day, but
2) below the mid-point between open and closing prices of the previous day.
(7) ‘Piercing Line Pattern’
The Piercing Pattern is a bullish candlestick reversal pattern, similar to the Bullish Engulfing Pattern (see: Bullish Engulfing Pattern). There are two components of a Piercing Pattern formation:
- Bearish Candle(Day 1)
- Bullish Candle(Day 2)
A Piercing Pattern occurs when a bullish candle on Day 2 closes above the middle of Day 1’s bearish candle.
Moreover, price gaps down on Day 2 only for the gap to be filled (see:Gaps) and closes significantly into the losses made previously in Day 1’s bearish candlestick.
The rejection of the gap up by the bulls is a major bullish sign, and the fact that bulls were able to press further up into the losses of the previous day adds even more bullish sentiment. Bulls were successful in holding prices higher, absorbing excess supply and increasing the level of demand.
(8) ‘Bullish Engulfing Pattern’
A chart pattern that forms when a small black candlestick is followed by a large white candlestick that completely eclipses or “engulfs” the previous day’s candlestick.
The shadows or tails of the small candlestick are short, which enables the body of the large candlestick to cover the entire candlestick from the previous day.
As implied in its name, this trend suggests that the bulls have taken control of a security’s price movement from the bears.
This type of pattern usually accompanies a declining trend in a security, suggesting that a low or end to a security’s decline has occurred.
However, as usual in candlestick analysis, the trader must take the preceding and following days’ prices into account before making any decisions regarding the security
(9) ‘Bearish Engulfing Pattern’
A chart pattern that consists of a small white candlestick with short shadows or tails followed by a large black candlestick that eclipses or “engulfs” the small white one.
As implied by its name, a bearish engulfing pattern may provide an indication of a future bearish trend. This type of pattern usually accompanies an uptrend in a security, possibly signaling a peak or slowdown in its advancement.
However, whenever a trader analyzes any candlestick pattern, it’s important for him or her, before making any decisions, to consider the prices of the days that precede and follow the formation of the pattern.
(10) ‘Inverted hammer’
The inverted hammer is a type of chart pattern found after a downtrend and is usually taken to be a trend-reversal signal. The inverted hammer looks like an upside down version of the hammer candlestick pattern, and when it appears in an uptrend is called a shooting star.
The pattern is made up of a candle with a small lower body and a long upper wick which is at least two times as large as the short lower body. The body of the candle should be at the low end of the trading range and there should be little or no lower wick in the candle.
The long upper wick of the candlestick pattern indicates that the buyers drove prices up at some point during the period in which the candle was formed, but encountered selling pressure which drove prices back down to close near to where they opened. When encountering an inverted hammer, traders often check for a higher open and close on the next period to validate it as a bullish signal.
(11) ‘Morning Star’
A bullish candlestick pattern that consists of three candles that have demonstrated the following characteristics:
1. The first bar is a large red candlestick located within a defined downtrend.
2. The second bar is a small-bodied candle (either red or white) that closes below the first red bar.
3. The last bar is a large white candle that opens above the middle candle and closes near the center of the first bar’s body.
As shown by the chart, this pattern is used by traders as an early indication that the downtrend is about to reverse.
A morning star pattern can be useful in determining trend changes, particularly when used in conjunction with other technical indicators. Many traders also use price oscillators such as the MACD and RSI to confirm the reversal.
(12) ‘Evening Star’
A bearish candlestick pattern consisting of three candles that have demonstrated the following characteristics:
1. The first bar is a large white candlestick located within an uptrend.
2. The middle bar is a small-bodied candle (red or white) that closes above the first white bar.
3. The last bar is a large red candle that opens below the middle candle and closes near the center of the first bar’s body.
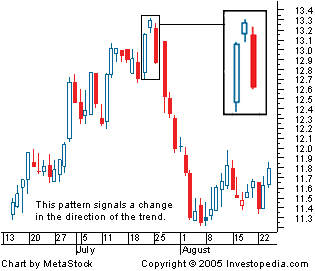
As shown by the chart below, this pattern is used by traders as an early indication that the uptrend is about to reverse.
Evening star formations can be useful in determining trend changes, particularly when used in conjunction with other indicators. Many traders use price oscillators and trendlines to confirm this candlestick pattern.
(13) ‘Harami Cross’
A trend indicated by a large candlestick followed by a doji that is located within the top and bottom of the candlestick’s body. This indicates that the previous trend is about to reverse.
A Harami cross can be either bullish or bearish, depending on the previous trend. The appearance of a Harami Cross, rather than a smaller body, increases the likelihood that the trend will reverse.
(14) ‘Bearish Harami’
A trend indicated by a large candlestick followed by a much smaller candlestick with a that body is located within the vertical range of the larger candle’s body. Such a pattern is an indication that the previous upward trend is coming to an end.
A bearish harami may be formed from a combination of a large white or black candlestick and a smaller white or black candlestick.
The smaller the second candlestick, the more likely the reversal. It is thought to be a strong sign that a trend is ending when a large white candle stick is followed by a small black candlestick.
(15) ‘Shooting Star’
A type of candlestick formation that results when a security’s price, at some point during the day, advances well above the opening price but closes lower than the opening price.
In order for a candlestick to be considered a shooting star, the formation must be on an upward or bullish trend. Furthermore, the distance between the highest price for the day and the opening price must be more than twice as large as the shooting star’s body.
Finally, the distance between the lowest price for the day and the closing price must be very small or non existent.
(Sources :- www.investopedia.com)




You must be logged in to post a comment.